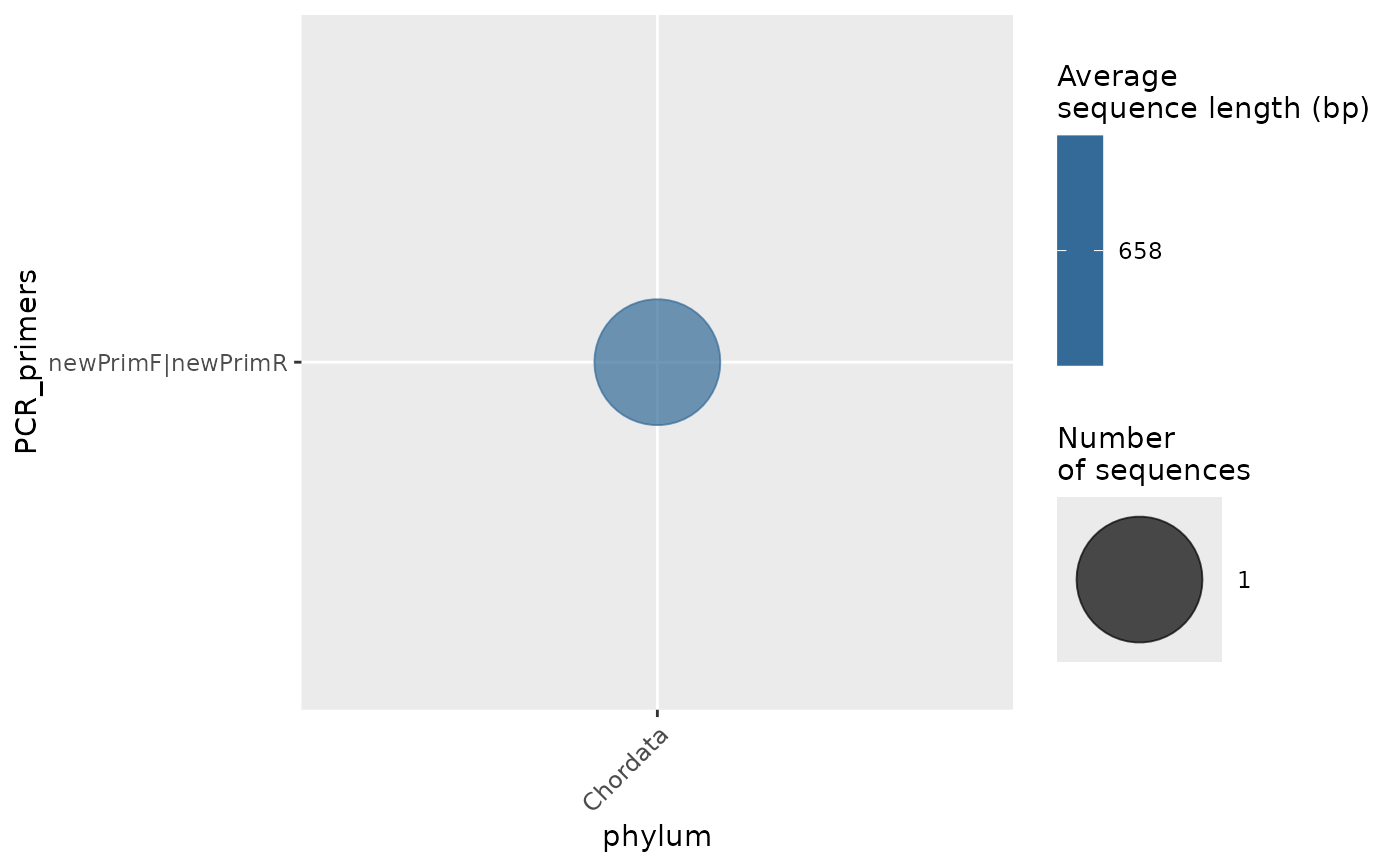
This function will plot any primer name present in the object provided to the `refdb` argument in the x axis, showing the number of records as size of circles, while the color intensity of the circle is given by the length `"average"` or `"range"` of the sequences amplified using that primer. This function was inspired and modified by the code presented in the paper by Gwiazdowski et al. (2015) https://doi.org/10.1371/journal.pone.0125635.
Usage
plot_primers(
  refdb,
  level = "phylum",
  select = NULL,
  size_range = NULL,
  measure = "average",
  tax.fct.levels = NULL,
  prim.fct.levels = NULL
)
Arguments
- refdb
`data.frame` A data frame object, as those recovered by the `download_ncbi`, `download_bold` and `loadBarcodeOre` functions.
- level
`character` A character string indicating which taxonomic level the x axis should refer to. It should be one of "phylum", "class", "order", "family" and "genus". Defaults to `phylum`.
- select
`character` this parameter allows to pre-filter the refdb object based on a taxonomic name. Defaults to `NULL`.
- size_range
`integer` This allows to change the size of bubbles. A vector of length two should be supplied. Defaults to `NULL`, which translates into `c(2, 30)`.
- measure
`character` Either `"range"` or `"average"`. In the first case, the range of length in the sequences of the records filtered for each combination of primer and taxonomic name will be shown. The average length will be shown otherwise. Defaults to `"average"`.
- tax.fct.levels
`character` A vector of taxonomic names that allows to re-order the x axis based on a custom order.
- prim.fct.levels
`character` A vector of primers' names that allows to re-order the y axis based on a custom order.
Value
`ggplot` A Bubble plot, which can be assigned and further modified using the package `ggplot2`.
Examples
rec <- loadBarcodeOre(example_record, example_sequence)

plot_primers(rec)